OTM Benchmark
OTM benchmark is a framework for benchmarking object-triple mapping (OTM) libraries.
The benchmark framework can be used to measure:
- Performance of OTM libraries
- Memory utilization of OTM libraries
It is available at https://github.com/kbss-cvut/otm-benchmark.
An OTM library comparison paper including this benchmark has been published in the Semantic Web journal [1].
Model
The object model used by the application is relatively simple and is illustrated on the following UML class diagram:
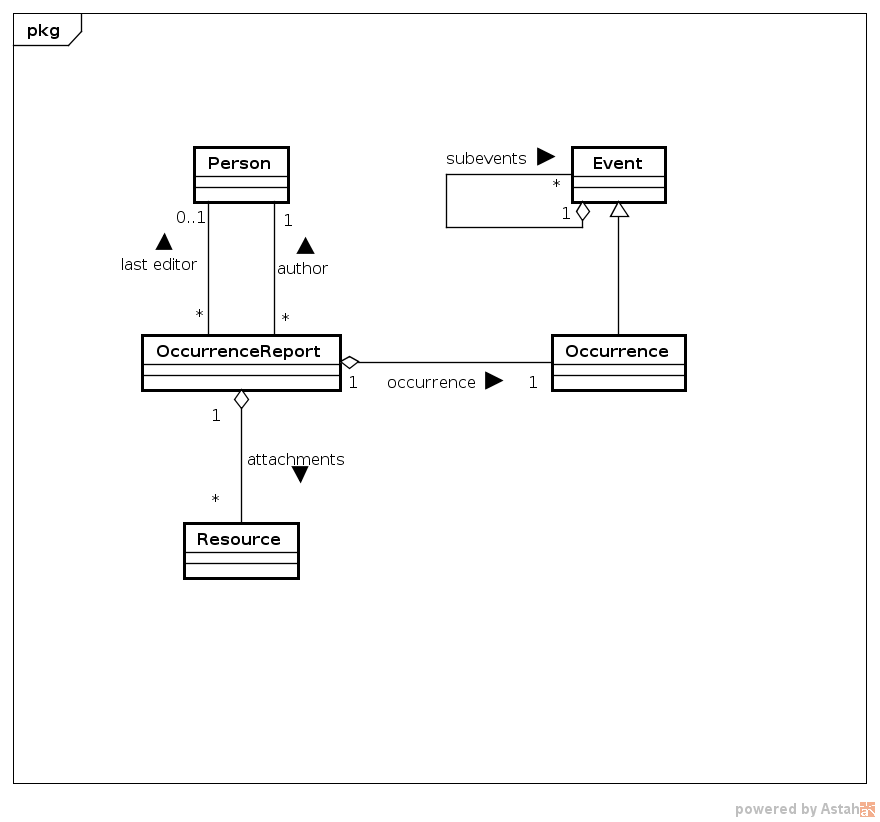
Operations
The benchmark consists of the following six operations:
Create
Create creates new instances of OccurrenceReport and associates them with a random author and last editor. Then, each of these new reports is persisted in a separate transaction. This the usual mode of operation of business web applications, where data come in requests through the REST API and are saved.
Batch Create
Batch create basically does the same as create, but all the reports are persisted in one transaction, simulating batch processing by an application.
Retrieve
Retrieve pre-persists data much like batch create. Then, each of the persisted reports is retrieved separately and its attributes are checked. This simulates an application accessing details of each report.
Retrieve All
Retrieve all also pre-persists data like batch create. Then, all the reports are retrieved using either a SPARQL query or a findAll method of the tested library API, depending on what is supported.
Update
Update takes the pre-persisted data and modifies half of the reports, each in a separate transaction. The update concerns singular and plural attributes representing both references to other entities and literal values.
Delete
Delete takes the pre-persisted data and deletes half of the reports, each in a separate transaction. The reports are deleted including all of their references (except for the author and last editor).
Execution
The benchmark is able to output both already processed results containing average runtime, quartiles, median, fastest and slowest round time and total execution time.
It can also be instructed to output raw round execution times into separate files for each tested library, so that they can be processed by other statistics SW (e.g. R).
Benchmark Setup
The benchmark was executed for the following libraries:
Since they are all based on RDF4J, the benchmark results allow for a direct comparison. Adding new libraries to the comparison is possible, but if they are based on a different API, the execution results may not be directly comparable, since the storage performance will play a role (unless the new library can be run against the same storage as the others, of course).
The execution environment used looks as follows:
- OS: Linux Mint 17.3 64-bit
- CPU: Intel Core i5-750 2.67 GHz (4 cores)
- RAM: 16GB
- Disk: Samsung SSD 850 EVO 250GB
- Java: Java HotSpot JDK 8u161, 64-bit
- Storage: GraphDB Free 8.4.1
Performance
Performance results were collected from 3 separate runs of the benchmark application. Each run consisted of 20 warm-up rounds and 100 measured rounds.
Memory
Memory utilization was measured by a dedicated runner, which executed a combination of Create, Retrieve all and Delete for a specified period of time.
Results were collected by instructing JVM to output garbage collection info using the -XX:+PrintGCDetails flag. GCViewer was then used to analyze the results.
The following setup was used in the evaluation:
- Runtime: 4 hours,
- Heap size: 40 MB,
- Default garbage collector settings.
Results
0.0.6 - 2018-11-16 (current version)
Libraries used:
- AliBaba 2.1
- Empire 1.0
- JOPA 0.10.7
- KOMMA 1.3.3-SNAPSHOT
- RDFBeans 2.2
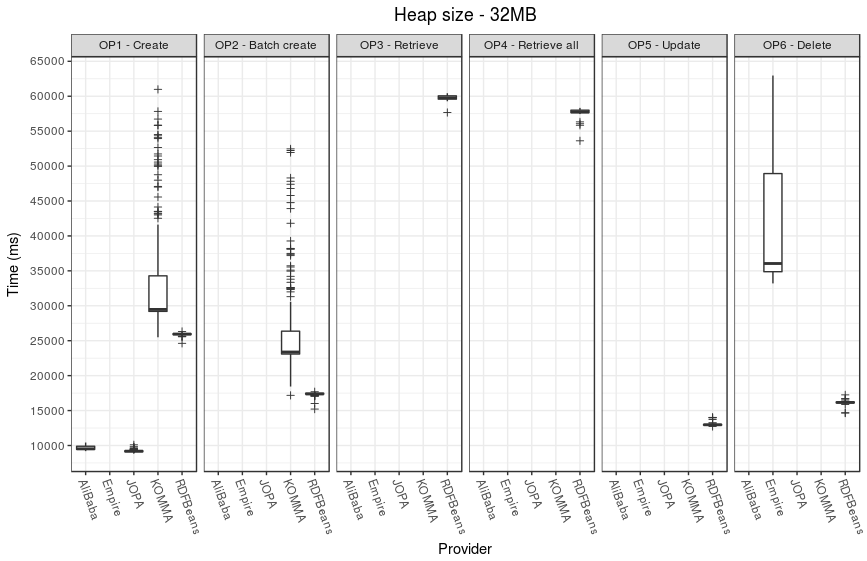
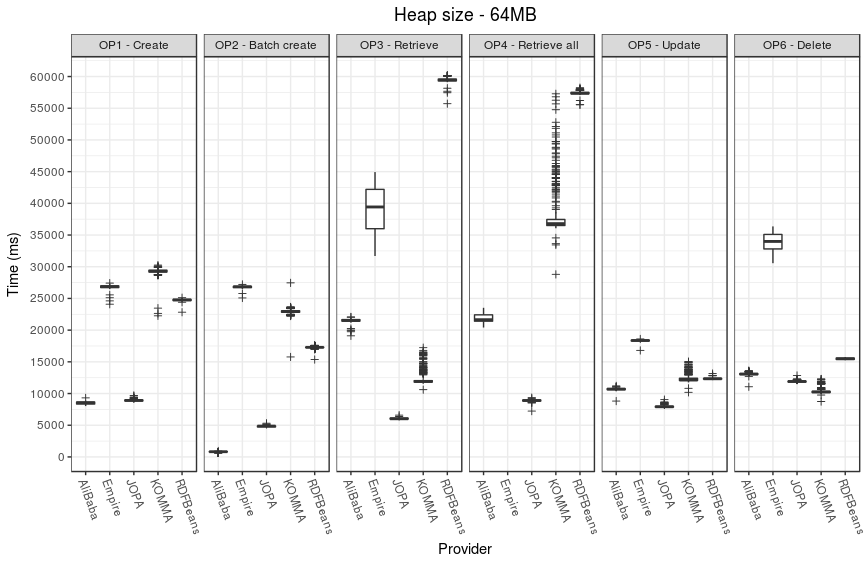
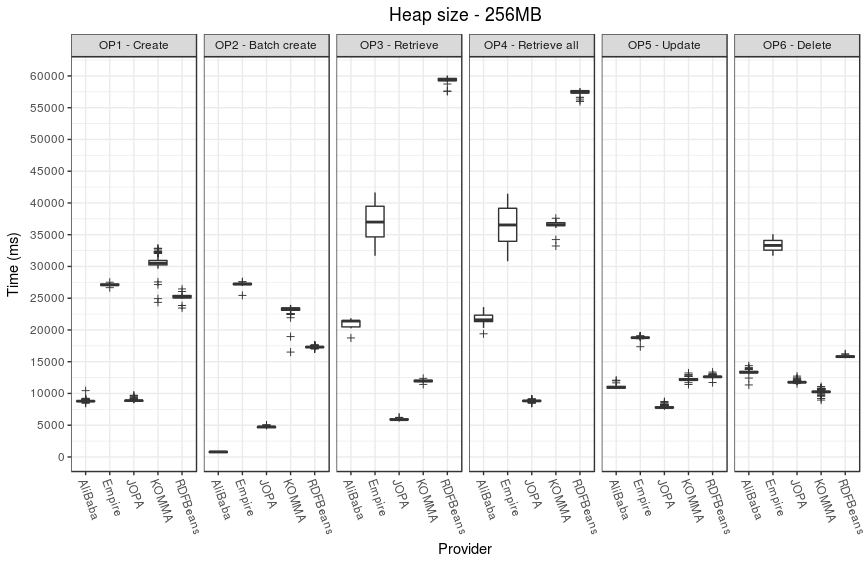
Performance
ZIP file with raw execution results is available - performance-data.zip.
It contains performance data for each operation, each provider and each heap size. In addition, it contains consolidated CSV files suitable for processing in R.
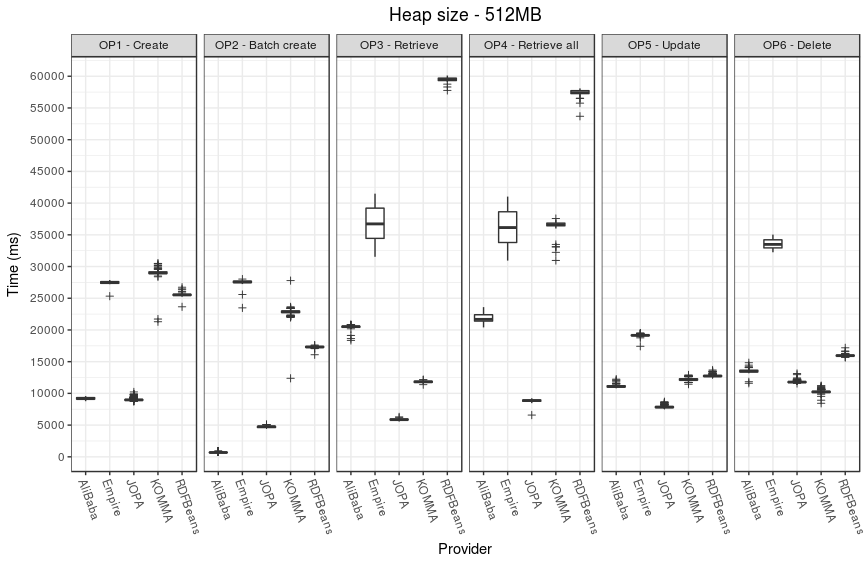
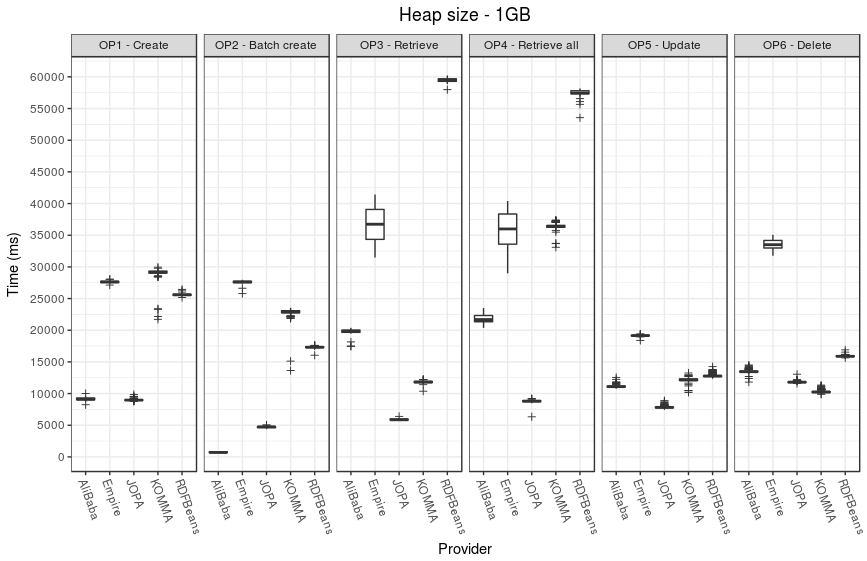
The following plots illustrate the performance results.

Memory
Raw output of the JVM is available in memory-data.zip.
The following table sums up the results in terms of the number of young generation garbage collection events (YGC), full garbage collection events (FGC), accumulated garbage collection pause time (GCT) and application throughput.
| Measure | AliBaba | Empire | JOPA | KOMMA | RDFBeans |
|---|---|---|---|---|---|
| YGC | 14 311 | 14 169 | 26 049 | 44 706 | 29 658 |
| FGC | 11 685 | 13 320 | 2 586 | 98 | 51 |
| GCT (s) | 496.98 | 1 326.58 | 147.78 | 65.36 | 40.4 |
| Throughput (%) | 96.37 | 84.56 | 98.97 | 99.55 | 99.72 |
Older Versions
0.0.5 - 2018-06-04 (current version)
Libraries used:
- AliBaba 2.1
- Empire 1.0
- JOPA 0.9.5
- KOMMA 1.3.3-SNAPSHOT
- RDFBeans 2.2
Results: otm-benchmark-0.0.5.zip
References
- [1] Ledvinka, M.; Křemen, P., A comparison of object-triple mapping libraries, Semantic Web, 2019, 1-43. ISSN 2210-4968. doi: 10.3233/SW-190345.