Widoco and its alternatives
On Friday 15th December speaker Michal Med was discussing the documentation generators and visualization tools for RDF data and ontologies.

At the Knowledge-based and Software Systems Group, we often design and create ontologies and RDF data. The main problem with graph data is usually visualization and documentation – data are basically well described for machine reading, but humans may have problems with interpretation of interlinked graphs determined by persistent IRIs and all attributes in the form of triples.
There are few tools determined for automated generating of documentation based on the ontology content. Currently we are using Widoco [1] - the WIzard for DOCumenting Ontologies, but as we encountered some problems, we researched what alternatives are available for the documentation generation. Basically, there is only one relevant option for the usecase we are looking for, which is Python library and command-line interface for inspecting and visualizing RDF - Ontospy [2].
Presentation sums up the usage of both tools. What is missing in the presentation is a comparison between both tools. Both tools may be run from the command-line.
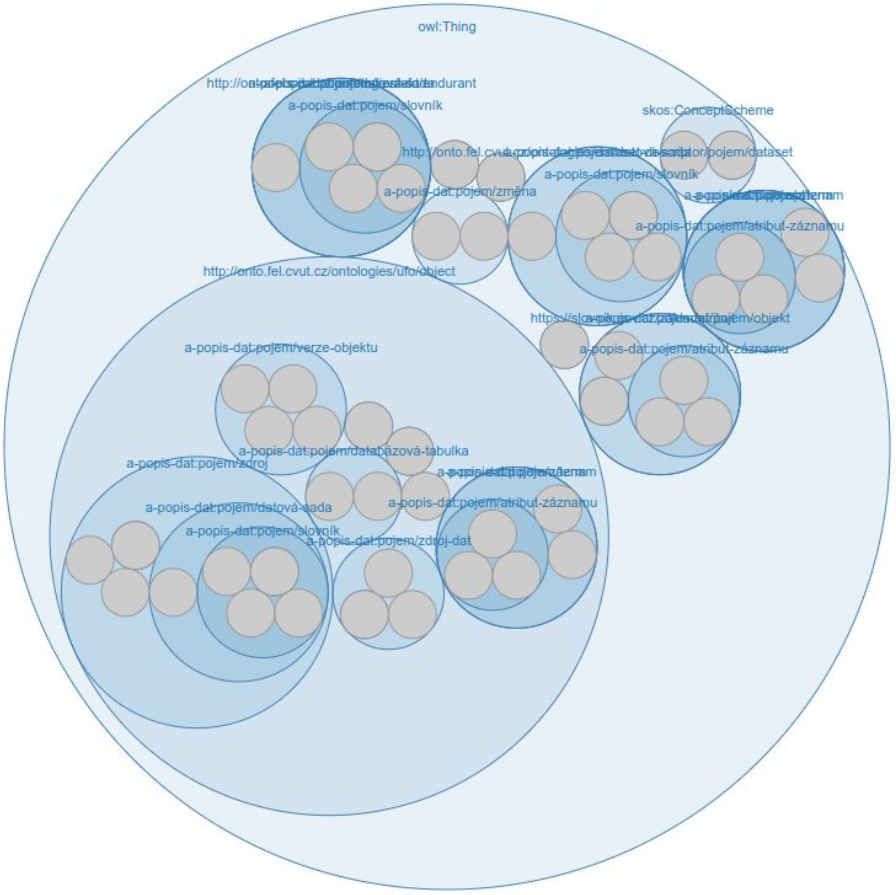
Ontospy is simpler solution, allowing to generate documentation by one command entirely from the ontology itself. It supports generating of documentation in the form of one- or multi-page HTML, Markdown or generation of visualization of graphs using D3.js [3] library. Unlike Widoco, all the content is generated from the ontologies, adding no description text. As the generated otput is html file(s), it is no real problem to add anything needed straight into the HTML. Moreover, Ontospy has some features, that are not available in Widoco. The most important is probably filtering option and building tree structure of all concepts, or divided by the OWL stereotypes. On the other hand, Widoco allows users to edit the content of the ontology in a very simple way (by including predefined sections) and supports multilinguality (at least for some languages). Downside of the Widoco tool is the need of filling the selected parts of the web sections by hand (e.g. they are not generated by the tool automatically from the ontology).
Documentation is perfect for human readability of the understanding of the meaning of the ontology and its concepts, but we also need to dereference IRIs of the concepts in order to be machine-readable. For the machine readability we know about a few tools, that are mentioned in the presentation. A lot of those tools are dead, so the listed tools are mainly those still alive in the development, with one exception, which is Pubby [4]. The goal of those tools is to identifiy the IRI and return some information about the resource, mainly in the machine readable form. The available tools diverge mainly in the type of the data store of the original resource. For our usecase it is important NOT to use SPARQL endpoint. Our resources are uploaded to the server and available there in the form of RDF file serialization. For this usecase we may use LodView [5], another suitable solution limited by the SPARQL endpoint is RhizomerEye [6].
The desired output for our usecase rquires the following steps:
- having the generated documentation in the form of HTML pages including some visual representation of graphs,
- dereference IRI depending on who is accessing the resource - humans are redirected to the HTML description of the resource in the documentation and machine gets the output given by dereferencing tool.
In order to achieve this goal, we need to select the proper tools for both steps and combine them in the suitable way.
The presentation slides are available at this link.
Further reading: